Open to roles
About
Data that earns its place in every decision.
I'm a 2nd-year CS + AI student at Newton School of Technology with real-world internship depth in Business Intelligence and cloud data engineering. My work lives at the intersection of pipeline architecture, dashboard design, and business decision-making.
At Maverick Secure, I've shipped contractor KPI dashboards, optimized AWS S3 pipelines, and transformed manual Excel chaos into analytics-ready systems — cutting reporting time by 80% and processing latency by 60%. I don't just analyze data. I make it persuasive.
01
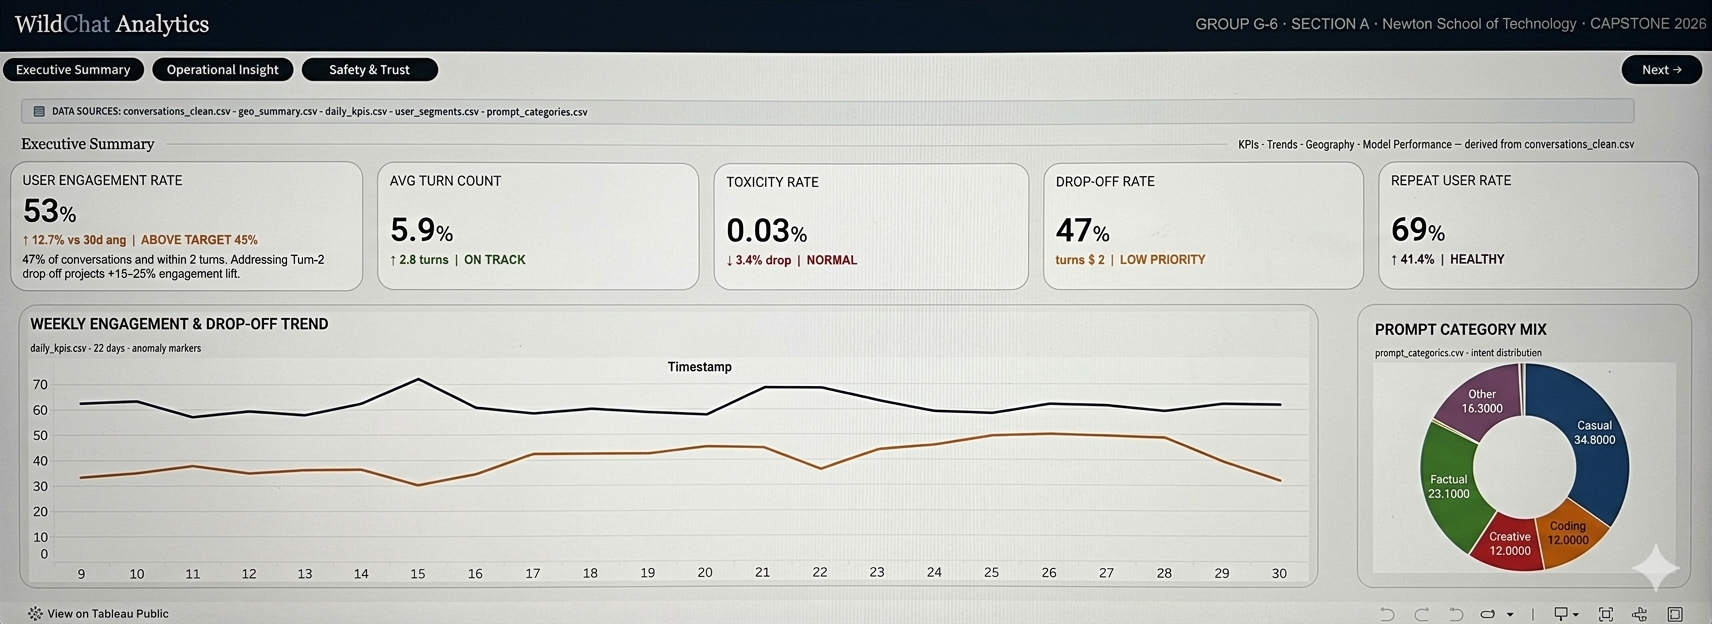
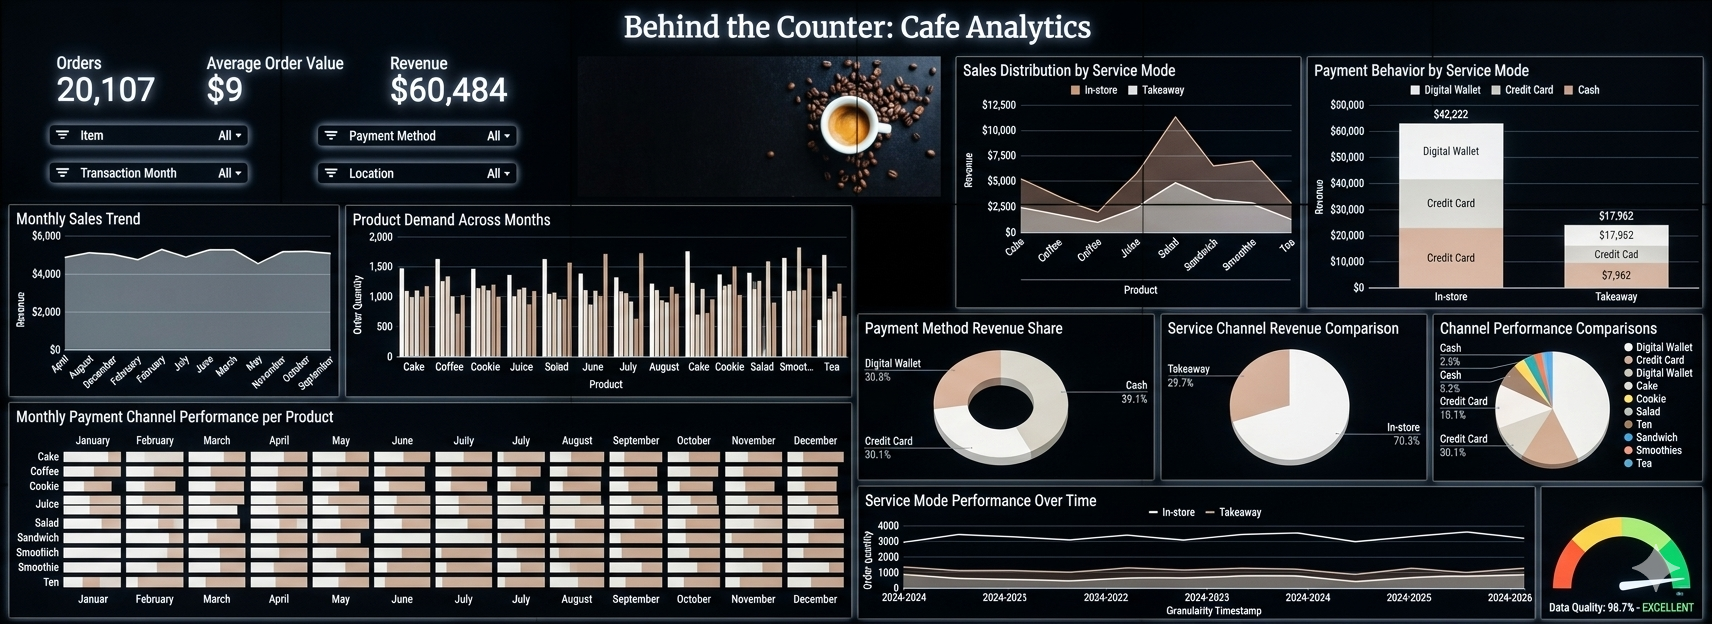
Dashboard Design
KPIs, hierarchy, and visual clarity that surface insights at a glance — designed for real decision-makers.
02
Data Pipelines
Structured datasets, S3 workflows, and DynamoDB query patterns engineered for analytics at scale.
03
Business Metrics
Revenue tracking, win rates, margin bands — turning operational noise into business intelligence.